Dashboards
The water dashboards use several interactive graphics to provide a general overview of wastewater treatment and water status monitoring in Austria and the status of Austrian running waters.
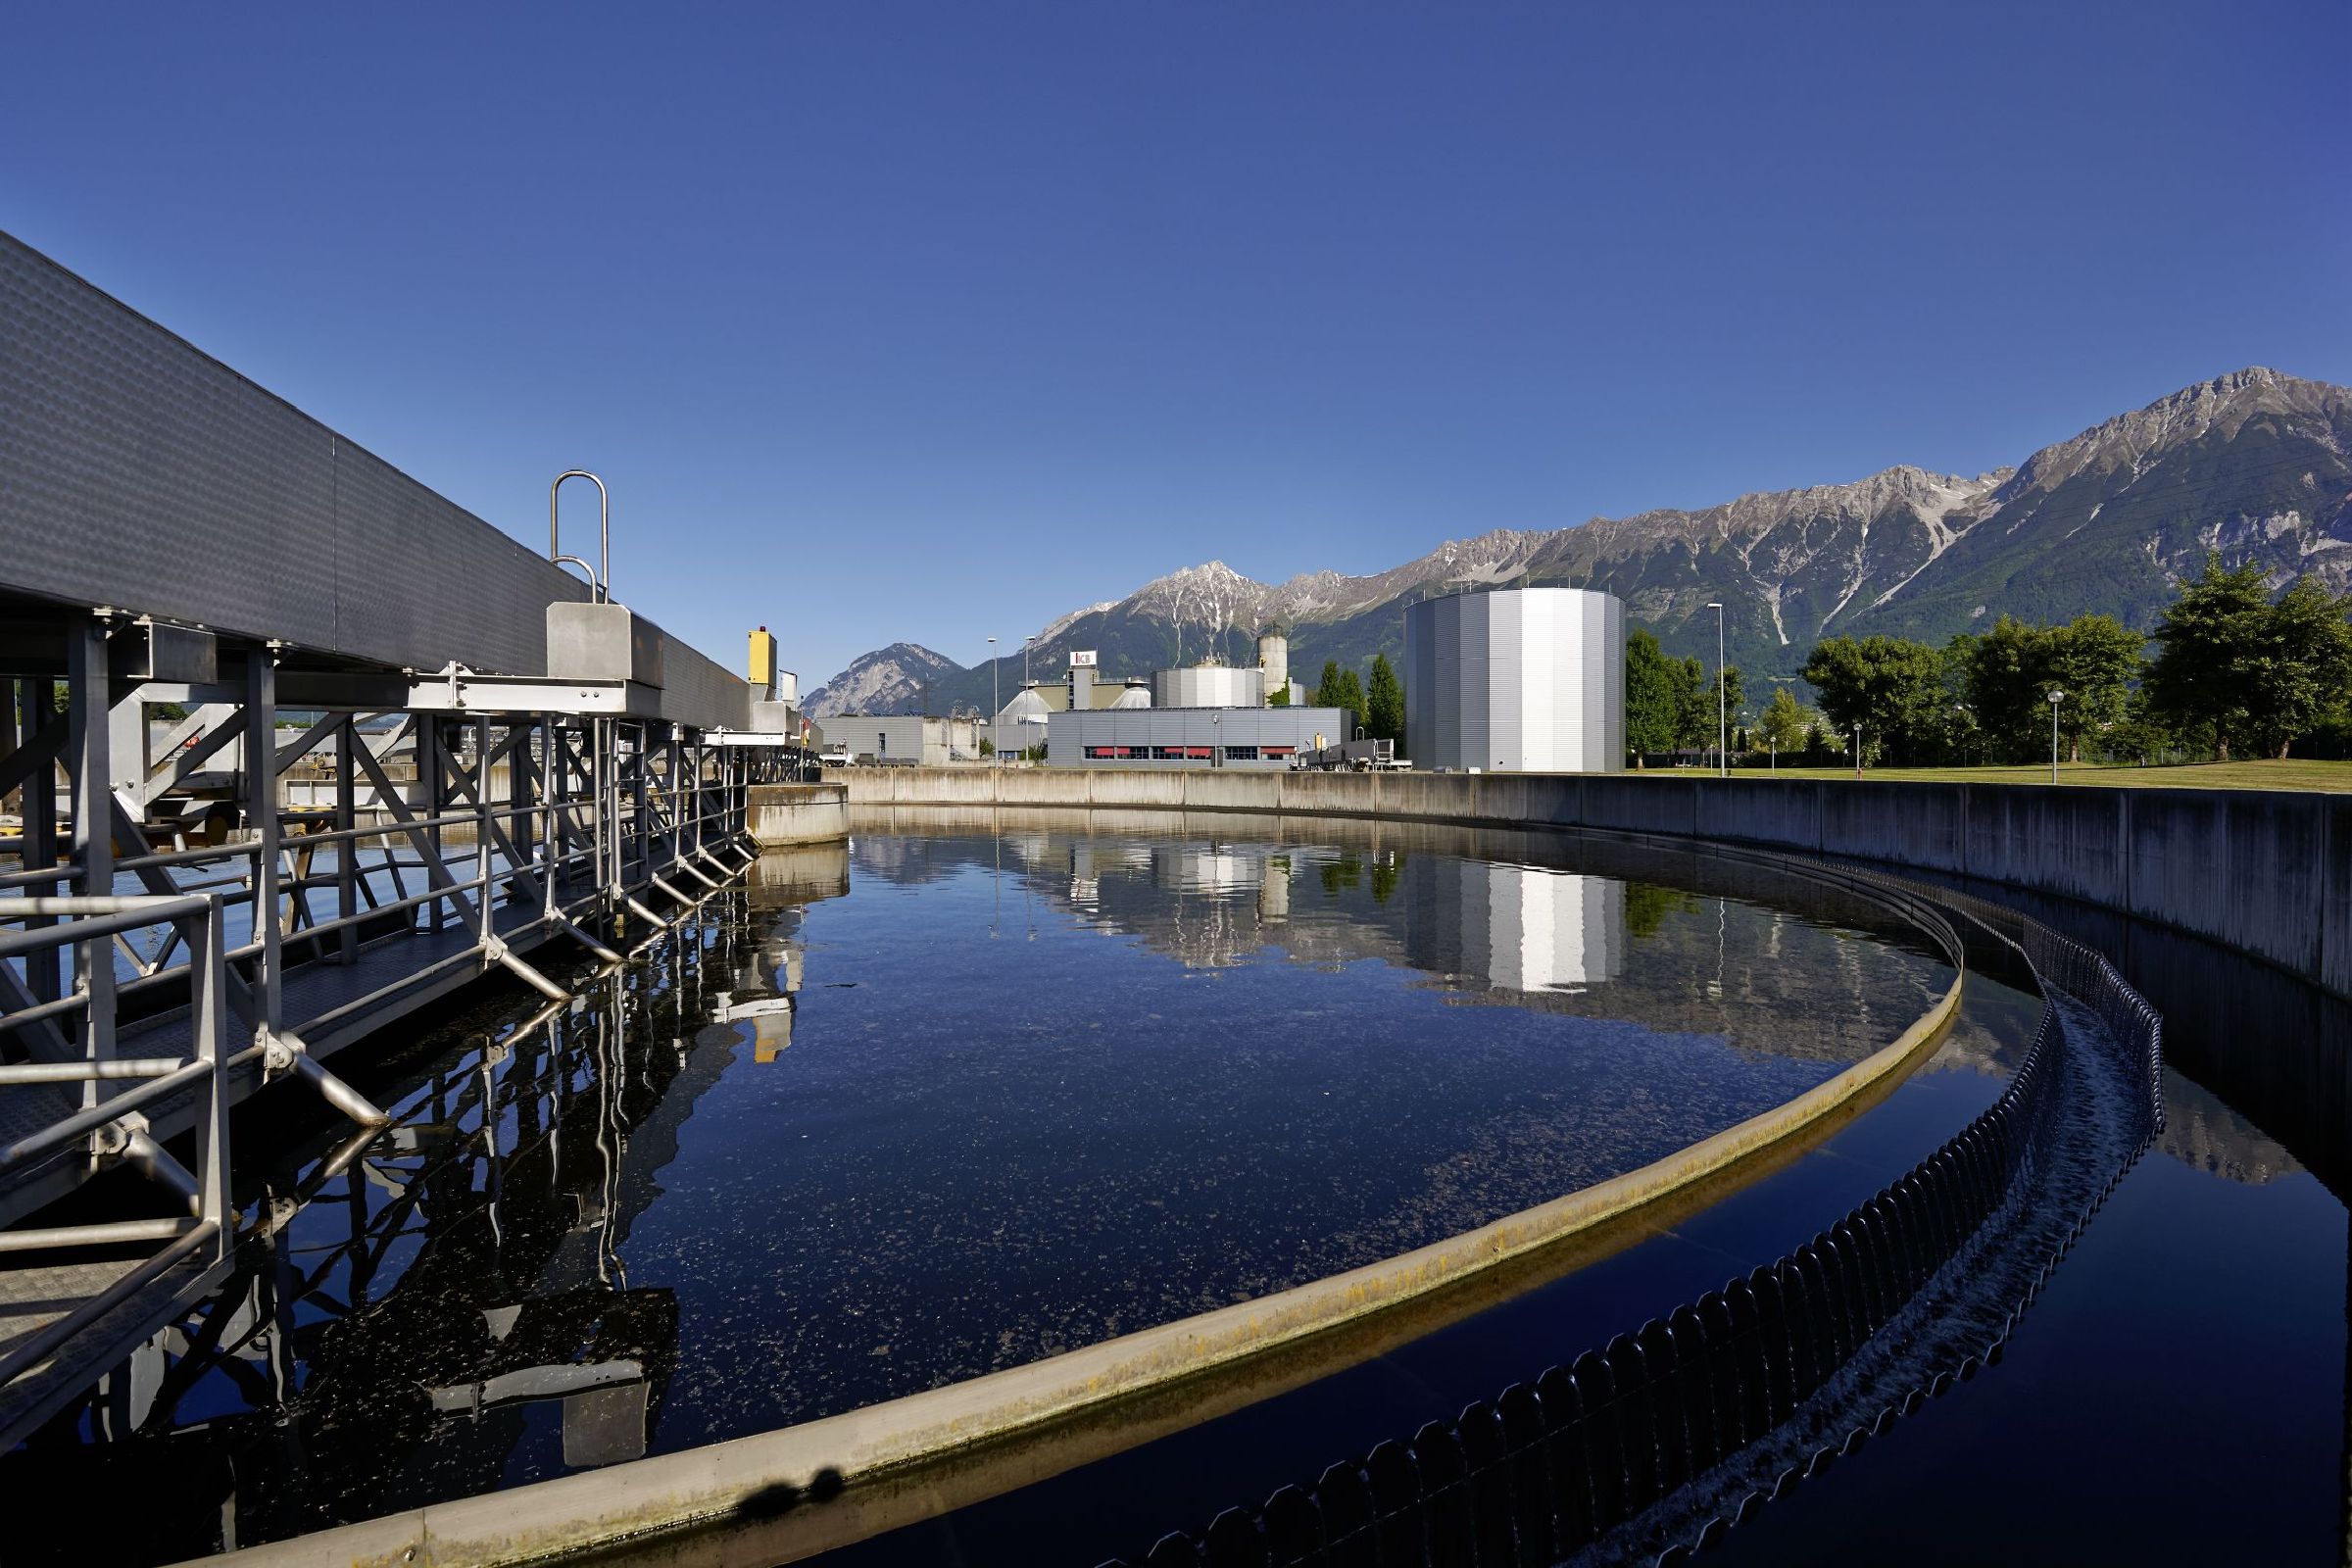
Wastewater
The wastewater management dashboard provides an overview of the Austrian wastewater management and its emissions, the municipal wastewater treatment plants and their treatment performance. The dashboard presents the most up-to-date data available collected in accordance with the Surface Water Bodies Emissions Register Ordinance (EMREG-OW, Federal Law Gazette II No 2017/207, as amended). Various questions are dealt with:
- How many wastewater treatment plants are there in Austria?
- How much wastewater is treated each year?
- Which wastewater constituents and which loads are discharged indirectly into a public sewage system or directly into a body of water?
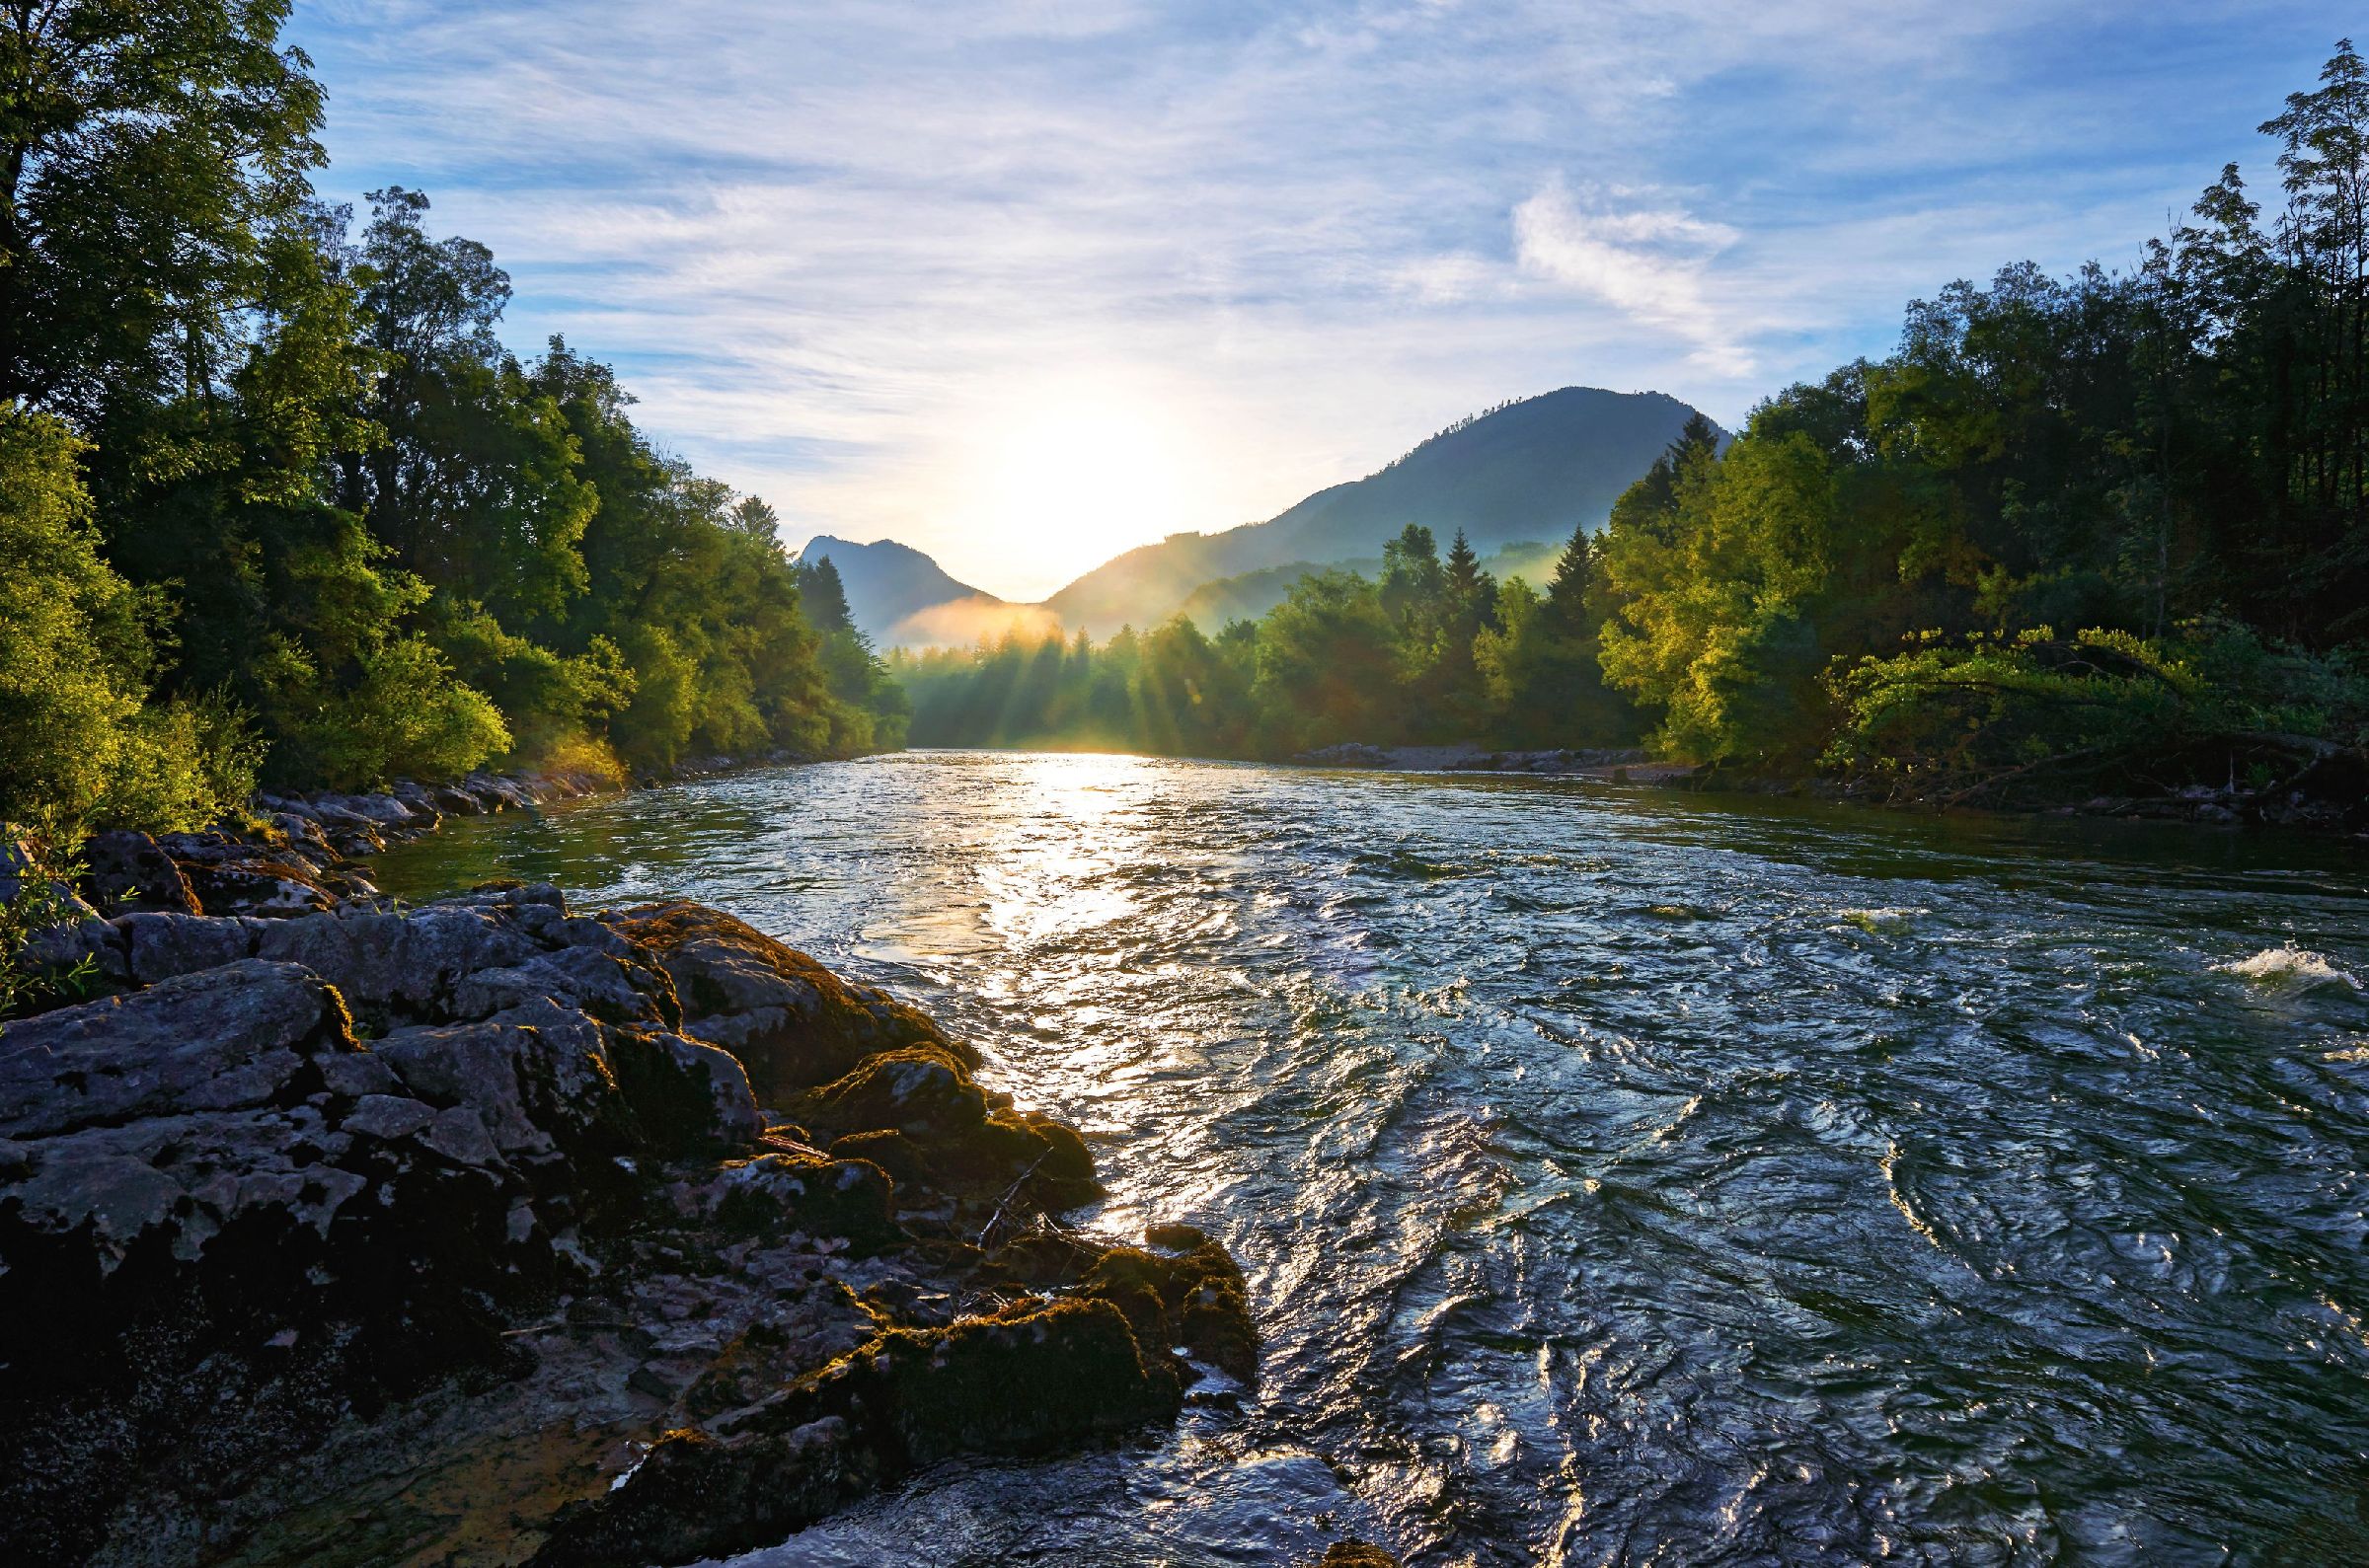
Water condition monitoring
The running waters monitoring dashboard and the groundwater monitoring dashboard provide an overview of the investigations carried out in running waters and groundwater as part of the Water Condition Monitoring Ordinance (GZÜV, Federal Law Gazette II No 479/2006 as amended). The information includes details of the monitoring network and the analysed parameters. Among other things, the following topics are covered:
- How many measuring points does the groundwater monitoring network comprise?
- Which substances are analysed in groundwater?
- Has a particular watercourse been analysed for contamination with physico-chemical substances, nutrients or certain pollutants?
- Has the ecological functionality been assessed on the basis of fish, macrozoobenthos (small animal organisms on the bottom of the body of water), phytobenthos (periphyton algae) or macrophytes (aquatic plants)?
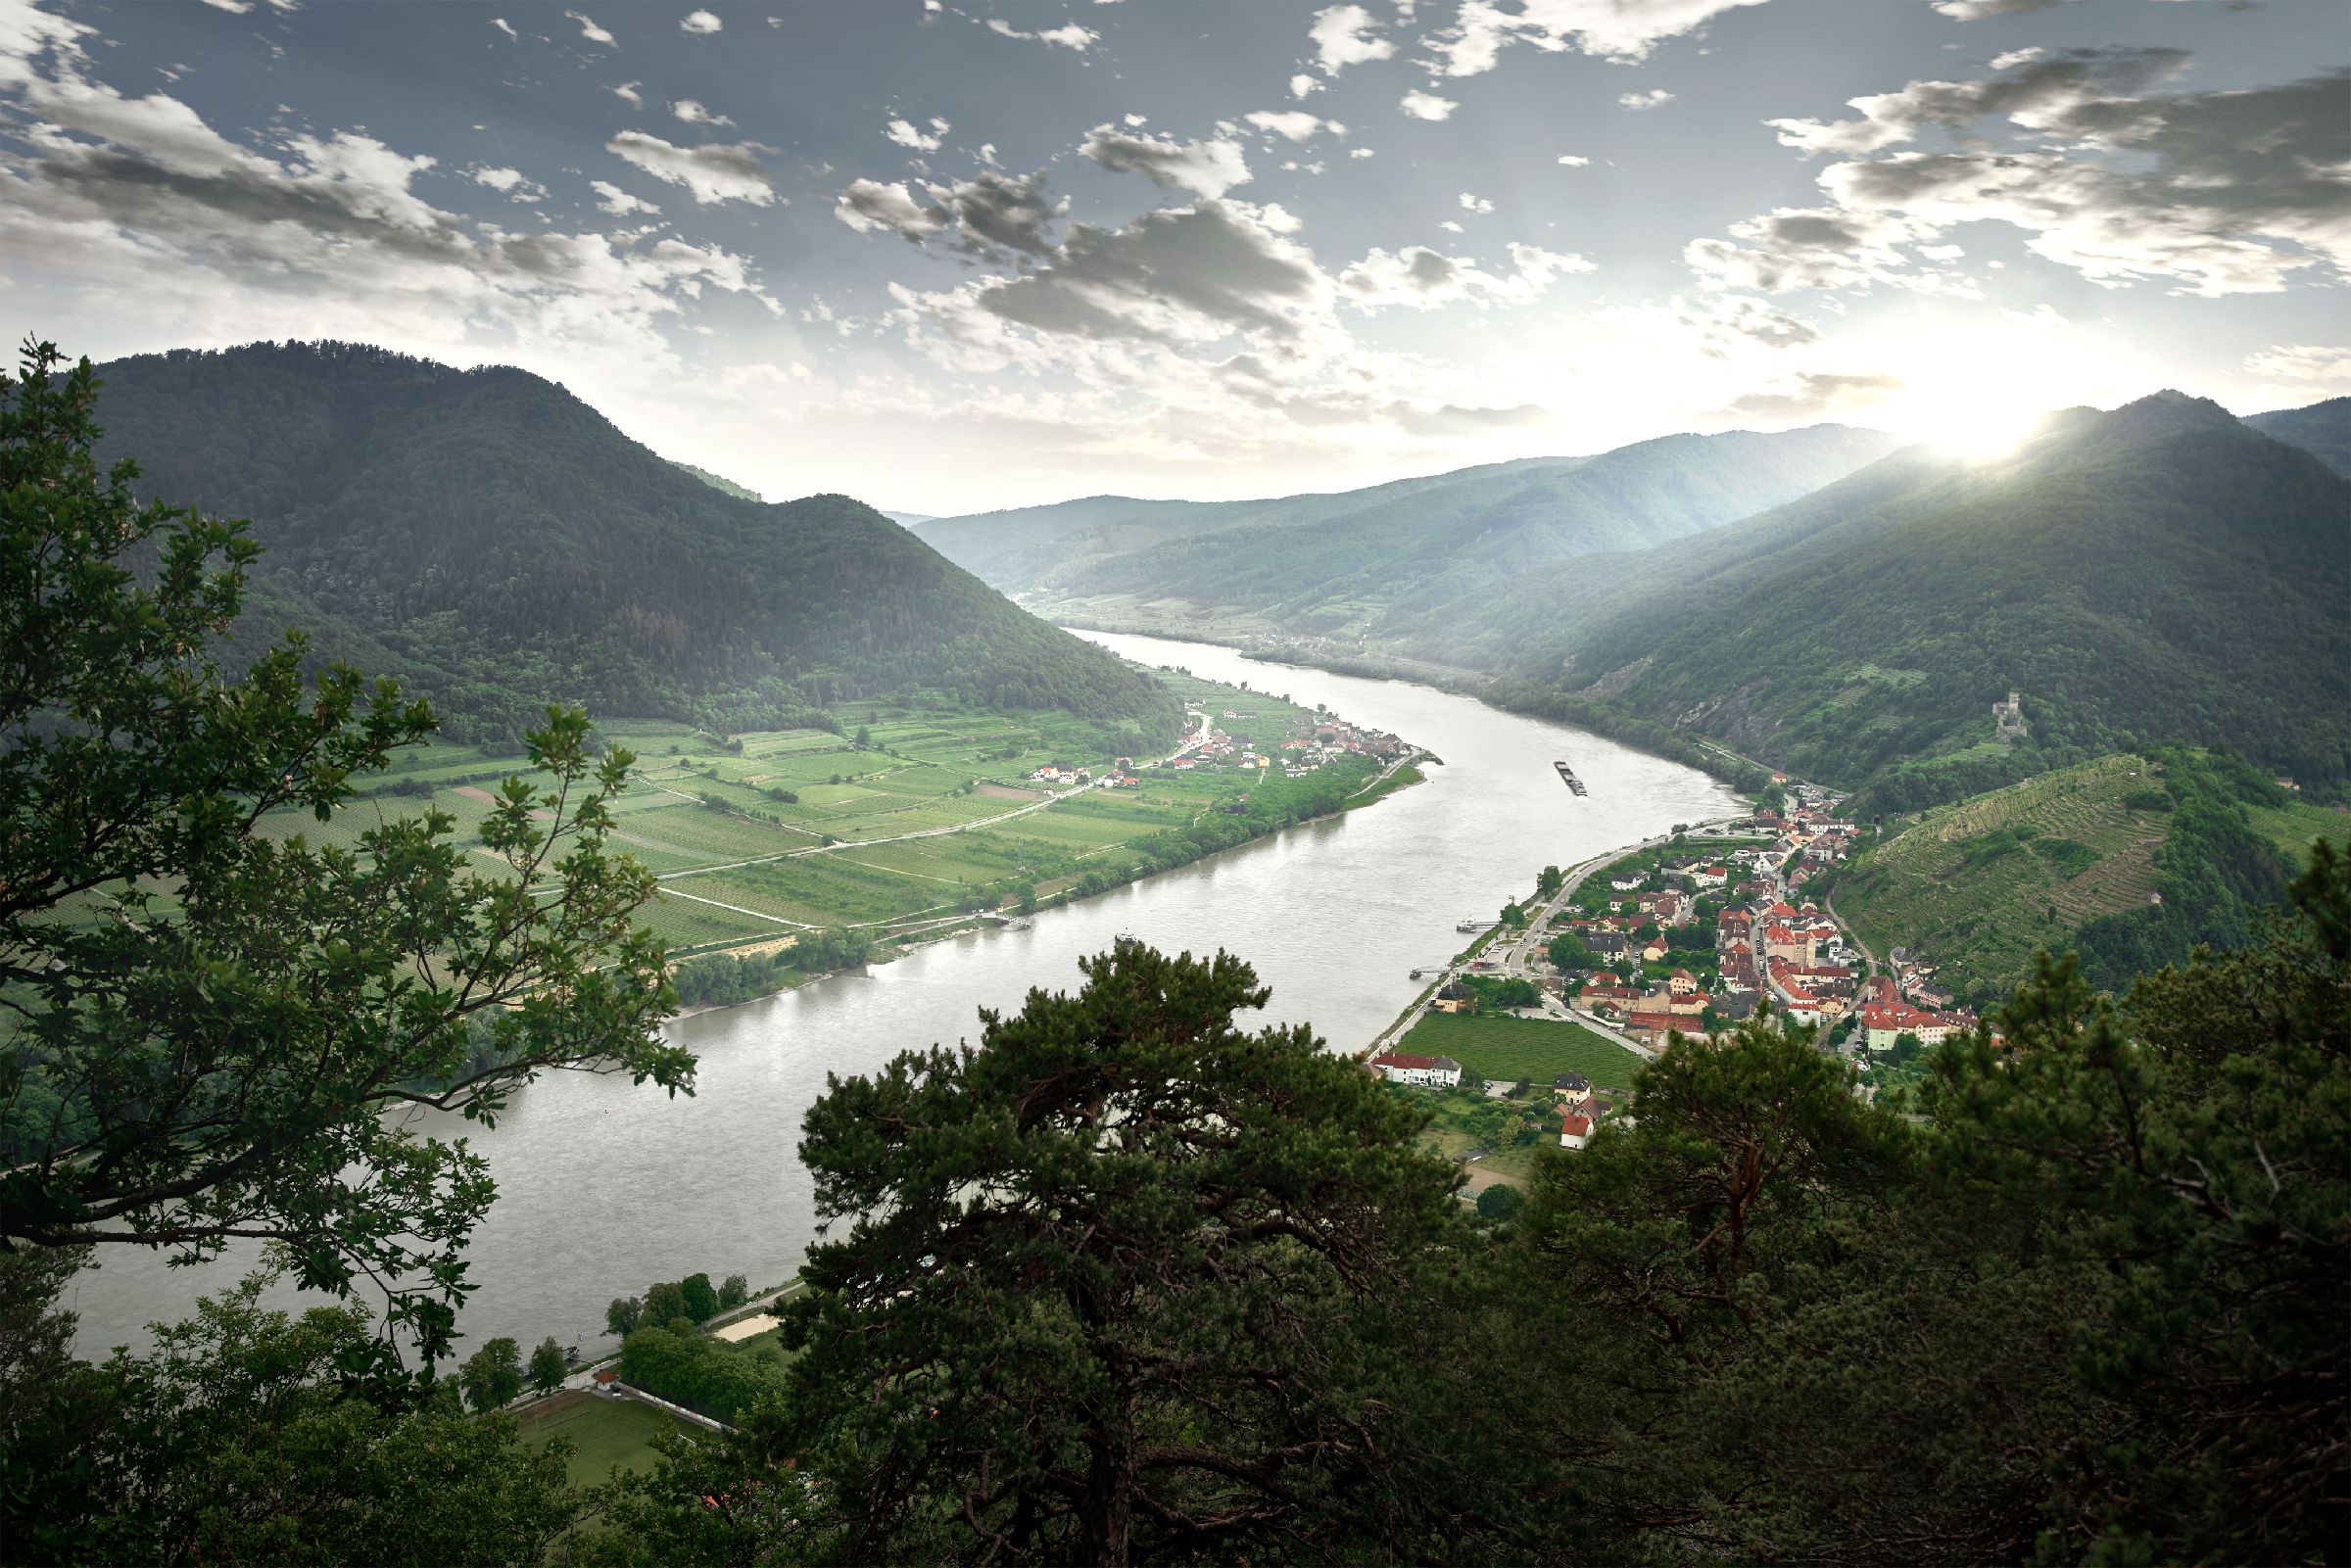
Status of running waters
The dashboard on the status of Austrian running waters provides an overview of the contents of the National Watercourse Management Plans (NWMP). The graphs provide information on the typology, pressures and condition of the water bodies. All information is available for the three management plans (2009, 2015, and 2021). In addition, the development of the ecological status or ecological potential over time from the 2009 NWMP to the current 2021 NWMP is presented. Among other things, the following questions are covered:
- What is the ratio of natural to artificial and heavily modified water bodies?
- Where are the morphological pressures lowest?
- What is the status of our waters and how many kilometres of river stretches are in a good ecological condition?
- Has the status of water bodies changed since the first National Watercourse Management Plan?